Weather Ball
How does the weather impact baseball?
Project Description
This project is a website that showcases how the weather impacts player performance in MLB(Major League Baseball) by presenting data visualizations that were made on Tableau Public. I decided to do this project because it combines two of my interests, weather and baseball, and I am also interested in information in general and how information can be analyzed to predict outcomes and situations.
Link to Website

Biography
Matthew Adelman is a Senior Interactive Multimedia Major at The College of New Jersey. He is also minoring in Computer Science. His interests include Game Design, Mobile Application Development, and Web Design. Interests & hobbies outside of school include history, baseball, and running.
Contact Information
Email: adelmam3@tcnj.edu
Project Steps & Challenges
-
Finding the data
All data I found for player stats and weather I found by going to each player’s stats page on MLB.com. From there I clicked on “Game Log” and scrolled through each of the games the player played in for 2021. I clicked on each game and was taken to a page called “MLB Game Day” which listed information for each game including the weather at the game and the player’s stats in that game.
-
Collecting the data
All data was collected by inputting it onto spread sheets in Google Drive
-
Determining conclusions based on data
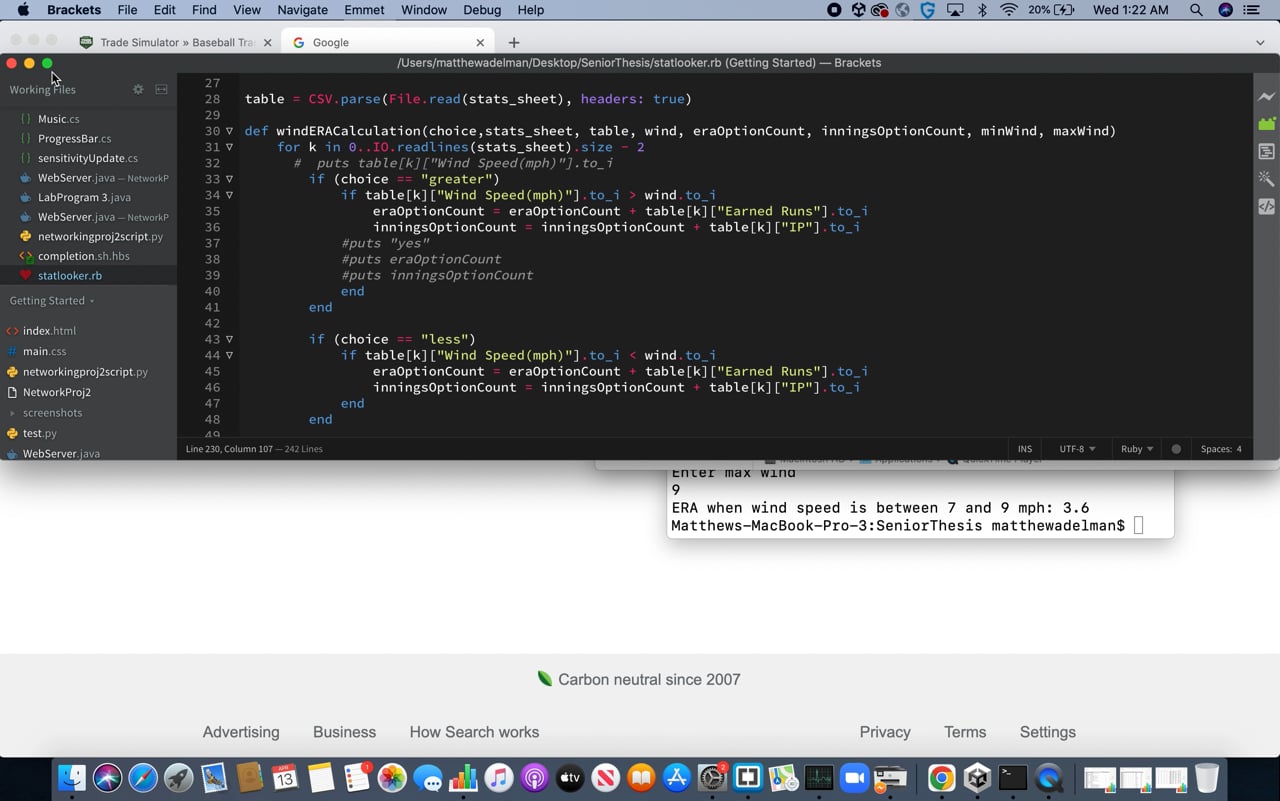
Data analysis was the hardest part. To determine conclusions based on the data(ie. how player x performs when the weather is y) I created a program in ruby to read in the data from the spread sheets. This program read that data, and calculated conclusions based on that data. For instance, the program can calculate what a player’s ERA(Earned Runs Average) is in relation to wind speeds.
-
Making Vizualiations
To make interactive data visualizations, I used Tableau Public, the free version of Tableau. To do this, I simply created a new data viz and downloaded each of my spread sheets of data onto the platform. From there, I could generate interactive graphics that presented my conclusions, such as circle area charts, bar charts, etc.
-
Creating the website
I decided to use Wix to create my website, as it is very template driven and it is easy to generate web pages. My web page is styled like a blog. I have articles on my website that talk about my data visualizations and the corresponding players for those visualizations.
-
Challenges
The largest challenge I faced this semester when working on this project was simply managing my time. I had to balance thesis with my other course work which was difficult at times. Collecting the data was not necessarily a challenge, but it was very time consuming as I had to manually go to stats pages and manually input the data into spread sheets. Perhaps a more automated approach would have saved me time.
A Ruby Program For Analyzing Player Stats Based on Weather Conditions